Information on the 2017 Marsden Fund round

Information about the number of funded proposals in the 2017 Marsden Fund round broken down by research area and institution, also including gender and ethnicity data
Number of applications by research area
The number of proposals by panel is given in Table 1. While overall 12.0% of the Expressions of Interest have been funded at the final stage, this percentage is not constant over all panels or categories as a change of just one proposal — attributed to either a Fast-Start or Standard award — in the number of successful proposals causes significant change in this percentage.
Here are the definitions of the 10 Marsden Fund panels
|
EoIs |
Full |
Proposed Contracts |
Success Rate |
|||||||||
|
FS |
STD |
Tot. |
FS |
STD |
Tot. |
FS |
STD |
Tot. |
FS |
STD |
Tot. |
|
|
Panel |
||||||||||||
|
BMS |
28 |
91 |
119 |
8 |
21 |
29 |
4 |
9 |
13 |
14.3% |
9.9% |
10.9% |
|
CMP |
16 |
72 |
88 |
5 |
15 |
20 |
3 |
8 |
11 |
18.8% |
11.1% |
12.5% |
|
EEB |
33 |
96 |
129 |
9 |
19 |
28 |
5 |
11 |
16 |
15.2% |
11.5% |
12.4% |
|
EHB |
37 |
59 |
96 |
10 |
13 |
23 |
5 |
7 |
12 |
13.5% |
11.9% |
12.5% |
|
EIS |
35 |
71 |
106 |
10 |
14 |
24 |
5 |
7 |
12 |
14.3% |
9.9% |
11.3% |
|
ESA |
46 |
74 |
120 |
11 |
13 |
24 |
8 |
7 |
15 |
17.4% |
9.5% |
12.5% |
|
HUM |
35 |
56 |
91 |
7 |
12 |
19 |
3 |
7 |
10 |
8.6% |
12.5% |
11.0% |
|
MIS |
26 |
79 |
105 |
10 |
16 |
26 |
6 |
9 |
15 |
23.1% |
11.4% |
14.3% |
|
PCB |
21 |
74 |
95 |
9 |
17 |
26 |
4 |
8 |
12 |
19.0% |
10.8% |
12.6% |
|
SOC |
53 |
104 |
157 |
15 |
25 |
40 |
6 |
11 |
17 |
11.3% |
10.6% |
10.8% |
|
Total |
330 |
776 |
1106 |
94 |
165 |
259 |
49 |
84 |
133 |
14.8% |
10.8% |
12.0% |
Table 1: Number of funded proposals by panel (and as a percentage of number of EOIs).
Proposals by institution
|
EoIs |
Full |
Funded |
Success Rate |
|||||||||
|
FS |
STD |
Tot. |
FS |
STD |
Tot. |
FS |
STD |
Tot. |
FS |
STD |
Tot. |
|
|
CRI |
||||||||||||
|
AgResearch |
4 |
5 |
9 |
0 |
1 |
1 |
0 |
0 |
0 |
0.0% |
0.0% |
0.0% |
|
GNS Science |
10 |
21 |
31 |
2 |
4 |
6 |
2 |
0 |
2 |
20.0% |
0.0% |
6.5% |
|
ESR |
2 |
1 |
3 |
1 |
0 |
1 |
0 |
0 |
0 |
0.0% |
0.0% |
0.0% |
|
Landcare Research |
3 |
9 |
12 |
1 |
3 |
4 |
1 |
2 |
3 |
33.3% |
22.2% |
25.0% |
|
NIWA |
7 |
18 |
25 |
2 |
2 |
4 |
2 |
2 |
4 |
28.6% |
11.1% |
16.0% |
|
Plant and Food Research |
1 |
7 |
8 |
0 |
3 |
3 |
0 |
1 |
1 |
0.0% |
14.3% |
12.5% |
|
Scion |
2 |
5 |
7 |
0 |
0 |
0 |
0 |
0 |
0 |
0.0% |
0.0% |
0.0% |
|
Totals |
29 |
66 |
95 |
6 |
13 |
19 |
5 |
5 |
10 |
17.2% |
7.6% |
10.5% |
|
OTHER |
||||||||||||
|
Sub-total Other (5 institutions) |
4 |
5 |
9 |
1 |
0 |
1 |
0 |
0 |
0 |
0.0% |
0.0% |
0.0% |
|
Totals |
4 |
5 |
9 |
1 |
0 |
1 |
0 |
0 |
0 |
0.0% |
0.0% |
0.0% |
|
PRIVATE |
||||||||||||
|
Sub-total Other (10 institutions) |
5 |
15 |
20 |
1 |
0 |
1 |
0 |
0 |
0 |
0.0% |
0.0% |
0.0% |
|
Totals |
5 |
15 |
20 |
1 |
0 |
1 |
0 |
0 |
0 |
0.0% |
0.0% |
0.0% |
|
TEO |
||||||||||||
|
Auckland Institute of Studies |
1 |
0 |
1 |
0 |
0 |
0 |
0 |
0 |
0 |
0.0% |
0.0% |
0.0% |
|
Auckland University of Technology |
12 |
15 |
27 |
2 |
1 |
3 |
0 |
0 |
0 |
0.0% |
0.0% |
0.0% |
|
Lincoln University |
3 |
8 |
11 |
1 |
1 |
2 |
0 |
0 |
0 |
0.0% |
0.0% |
0.0% |
|
Massey University |
44 |
85 |
129 |
16 |
21 |
37 |
10 |
16 |
26 |
22.7% |
18.8% |
20.2% |
|
Nelson Marlborough Institute of Technology |
0 |
1 |
1 |
0 |
0 |
0 |
0 |
0 |
0 |
0.0% |
0.0% |
0.0% |
|
Open Polytechnic of New Zealand |
1 |
0 |
1 |
0 |
0 |
0 |
0 |
0 |
0 |
0.0% |
0.0% |
0.0% |
|
The University of Auckland |
84 |
199 |
283 |
23 |
44 |
67 |
10 |
21 |
31 |
11.9% |
10.6% |
11.0% |
|
Unitec New Zealand |
1 |
0 |
1 |
1 |
0 |
1 |
0 |
0 |
0 |
0.0% |
0.0% |
0.0% |
|
University of Canterbury |
34 |
58 |
92 |
12 |
10 |
22 |
5 |
6 |
11 |
14.7% |
10.3% |
12.0% |
|
University of Otago |
47 |
170 |
217 |
16 |
51 |
67 |
9 |
24 |
33 |
19.1% |
14.1% |
15.2% |
|
University of Waikato |
23 |
38 |
61 |
4 |
3 |
7 |
1 |
3 |
4 |
4.3% |
7.9% |
6.6% |
|
Victoria University of Wellington |
41 |
112 |
153 |
11 |
20 |
31 |
9 |
8 |
17 |
22.0% |
7.1% |
11.1% |
|
Otago Polytechnic |
0 |
1 |
1 |
0 |
0 |
0 |
0 |
0 |
0 |
0.0% |
0.0% |
0.0% |
|
Te Wananga o Aotearoa |
0 |
1 |
1 |
0 |
0 |
0 |
0 |
0 |
0 |
0.0% |
0.0% |
0.0% |
|
Te Wananga-o-Raukawa |
0 |
1 |
1 |
0 |
1 |
1 |
0 |
1 |
1 |
0.0% |
100.0% |
100.0% |
|
Whitireia New Zealand |
1 |
0 |
1 |
0 |
0 |
0 |
0 |
0 |
0 |
0.0% |
0.0% |
0.0% |
|
Toi Ohomai Institute of Technology |
0 |
1 |
1 |
0 |
0 |
0 |
0 |
0 |
0 |
0.0% |
0.0% |
0.0% |
|
Totals |
292 |
690 |
982 |
86 |
152 |
238 |
44 |
79 |
123 |
15.1% |
11.4% |
12.5% |
|
Grand Total |
330 |
776 |
1106 |
94 |
165 |
259 |
49 |
84 |
133 |
14.8% |
10.8% |
12.0% |
Table 2: Number and percentages of funded proposals by institution, grouped by type of institution. The ‘Other’ category includes not-for-profit research institutes and the ‘Private’ category includes individuals and companies.
Gender and Ethnicity Data
The following tables presents the percentages of female and Māori researchers in the preliminary proposals, full proposals and recommended contracts. The figures present the current round for comparison with the data over time. The “Total” column represents all applicants in a particular category, regardless of gender or ethnicity.
|
N |
D |
F |
M |
Total |
Investigators Identifying |
||
|
Principal |
EoIs |
|
6 |
464 |
850 |
1321 |
35.1% |
|
Full |
|
116 |
202 |
321 |
36.1% |
||
|
Funded |
|
|
57 |
86 |
165 |
34.5% |
|
|
Associate |
EoIs |
10 |
2 |
545 |
1313 |
1870 |
29.1% |
|
Full |
|
146 |
325 |
476 |
30.7% |
||
|
Funded |
|
|
73 |
131 |
238 |
30.7% |
|
|
All |
EoIs |
|
8 |
1009 |
2163 |
3191 |
31.6% |
|
Full |
|
262 |
527 |
797 |
32.9% |
||
|
Funded |
|
|
130 |
217 |
403 |
32.3% |
Table 3: Gender data for 2017 proposals (Investigators identifying as: no response, N; Gender Diverse, D; Female, F; Male, M).
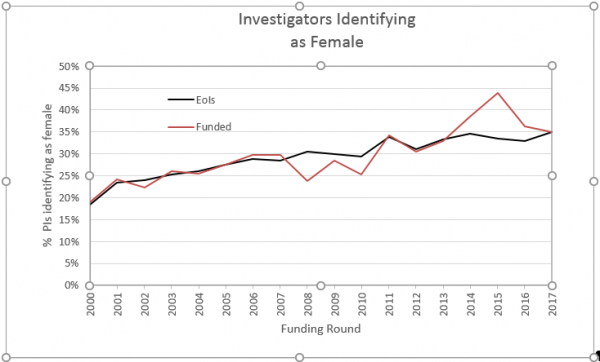
Figure 1: The percentage of Principal Investigators identifying as Female in the Marsden Fund.
|
No response |
Māori |
Total |
Investigators Identifying |
||
|
Principal |
EoIs |
1 |
62 |
1321 |
4.7% |
|
Full |
0 |
20 |
321 |
6.2% |
|
|
Funded |
0 |
15 |
165 |
9.1% |
|
|
Associate |
EoIs |
11 |
85 |
1870 |
4.5% |
|
Full |
3 |
28 |
476 |
5.9% |
|
|
Funded |
0 |
14 |
238 |
5.9% |
|
|
All |
EoIs |
12 |
147 |
3191 |
4.6% |
|
Full |
3 |
48 |
797 |
6.0% |
|
|
Funded |
0 |
29 |
403 |
7.2% |
Table 4: Ethnicity data for 2017 proposals.
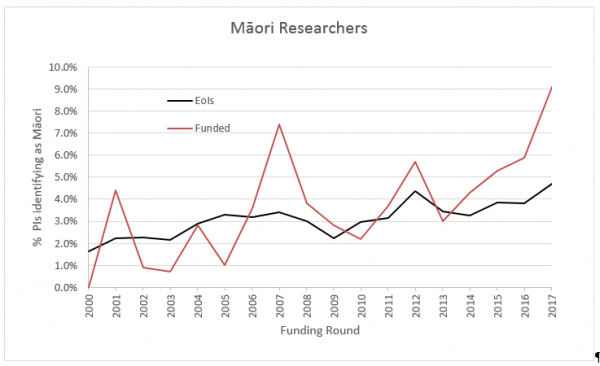
Figure 2: The percentage of Principal Investigators identifying as Māori in the Marsden Fund.