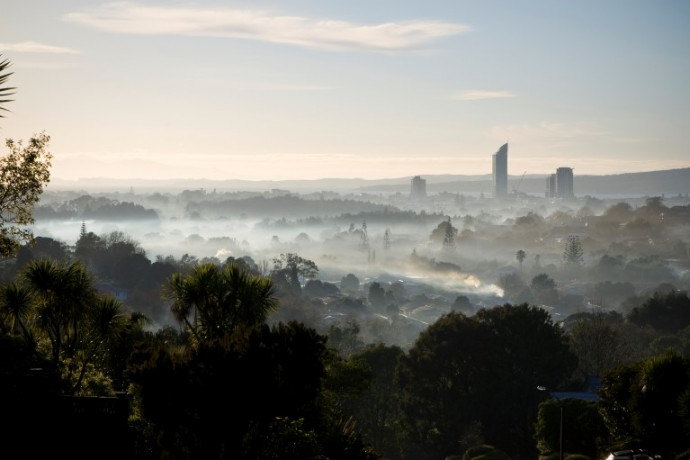
Take a walk on the polluted side: air pollutant exposure on busy roads
Dr Lena Weissert from University of Auckland explains her research to better measure our exposure to air pollutants as we go about our daily lives.
The World Health Organization considers poor air quality as the greatest environmental health risk. Amongst others it can increase lung cancer, strokes or worsen asthma symptoms. Most affected are older people, children, asthmatics or people with other respiratory problems. Of particular concern are pollutants like nitrogen dioxide (NO2) or particulate matter (PM2.5, PM10), which can accumulate to reach very high concentrations near busy roads or intersections. However, standard air quality measurements are often not set up to capture the high variability of pollutants along roads. For example, does it matter which side of the road we walk on? Or how long we are waiting at intersections? Or can we change our route to work to avoid high traffic emissions?
While we can model pollutant concentrations at a higher spatial resolution using so called land use regression (LUR) models or dispersion models, these approaches either lack temporal resolution or they require detailed data input that may not always be available. Recently, there has been an increasing interest in the development of low-cost and low-maintenance air quality instruments that can be deployed in high density networks to complement the regulatory air quality networks. So rather than having a few (often < 10) measuring sites across a whole city we can install 50 or even 100+ instruments. This offers an opportunity to continuously monitor traffic related air pollutants at a high spatial and temporal resolution, which gives us a better understanding about the variability of pollutant concentrations along busy roads or around intersections.
However, air quality measurements alone do not tell us anything about the exposure of individuals to air pollutants, which requires information about the interaction between pollutants and individuals. This depends on the duration of an individual being at a certain location and the volume of pollutants inhaled while being at this location. Exposure is often estimated by the concentration nearest to a limited number of locations for each individual, usually focusing on the residential address. However, given the often much higher pollutant concentrations near busy roads or intersections, it is important to also consider travel journeys (e.g. commute to work, walk to the supermarket), which can contribute considerably to people’s exposure to air pollutants.
A number of approaches have been undertaken to do this, using travel journals, questionnaires, GPS data and handheld air quality instruments, but these tend to be time consuming for participants as well as researchers. Thus, current research is exploring novel methods to obtain such information. In particular, there is an interest in using Google location data, Bluetooth or Wifi data available from smartphone devices to track people’s movements.
Another approach that we are testing as part of our current research is the potential of simulating individual movement patterns using Geographic Information Systems (GIS) and combining these with low-cost air pollution measurements and LUR models to obtain an estimate of people’s exposure to traffic related air pollutants. This would allow a relatively quick assessment of individual exposure based on which side of the road someone is walking on, how long they are waiting at intersections or which route they take to walk to work for example. An example is illustrated in the figure below, which shows modelled NO2 concentrations and two simulated pathways with the same start and end point but different route choices. Individual B, who walks through the park is exposed to lower NO2 concentrations than individual A that walks along the main road. Better knowledge of this can help improve intersection and road management and inform people about better route choices to work, school or the supermarket.
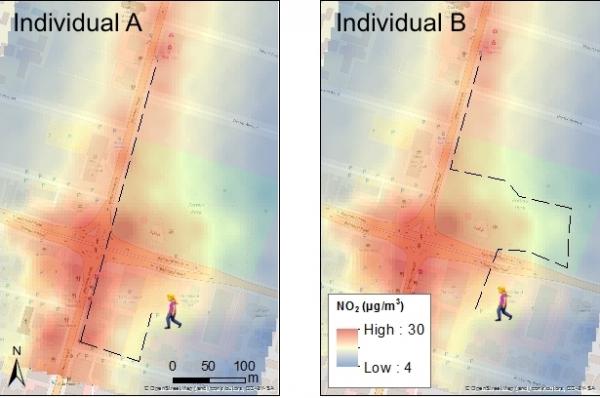
Figure 1. Simulated individual pathways superimposed on air pollutant concentrations modelled at a road section in Auckland using land use regression analysis.
Published August 2017
This post is from the Past and Future series where, as part of our 150th anniversary celebrations, early career researchers are invited to share discoveries in their fields from days gone by or give us a glimpse into where their research may take us in the future.